
Registry data · updated 6 October 2026
Lebanon property sales by year, 2016–2026
Eleven calendar years of Lebanese property sales as the Land Registry recorded them — including the three collapse years whose annual totals we could not find until now.
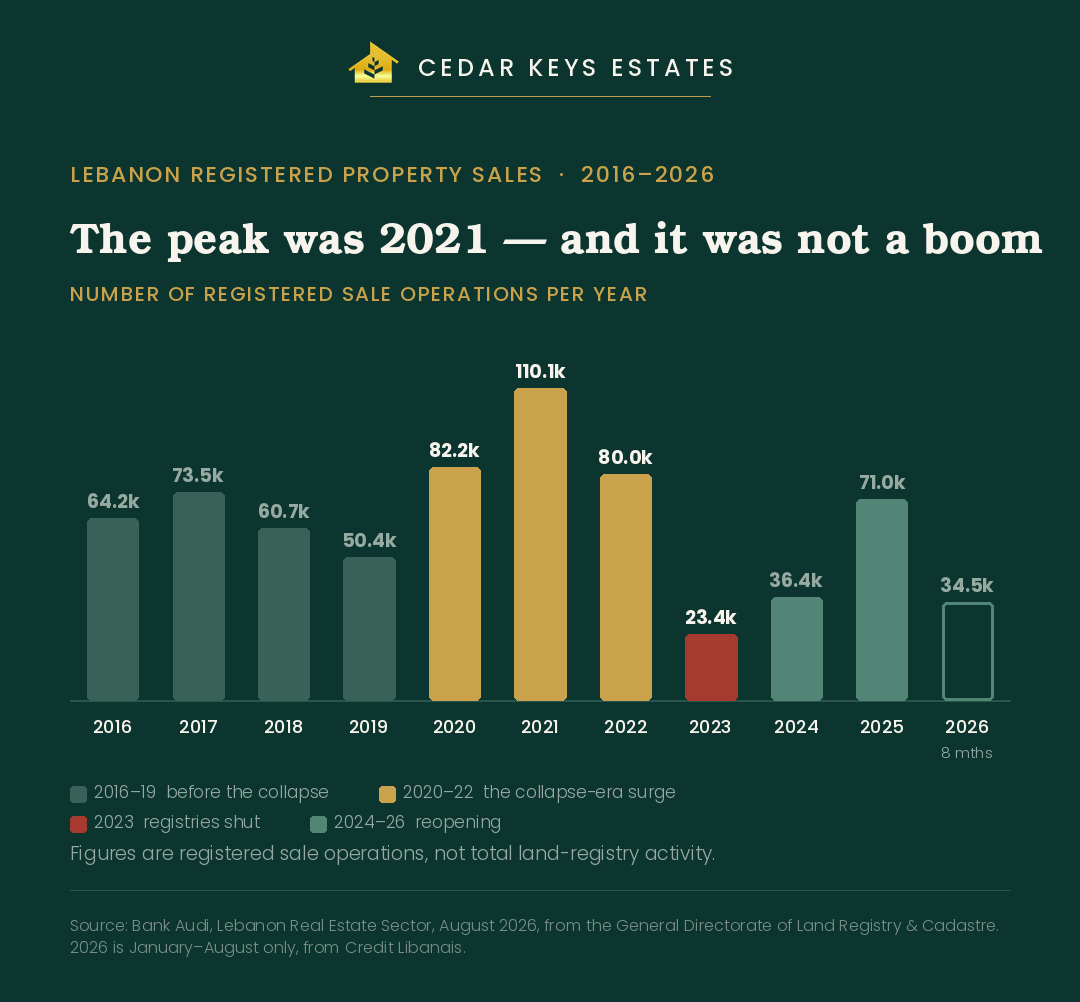
Correction, 6 October 2026. An earlier version of this page said that no full-year sales figure had ever been published for 2020, 2021 and 2022. That was wrong. Bank Audi’s Lebanon Real Estate Sector report of August 2026 carries the General Directorate’s annual series back to 2016, and we had not opened its multi-year table.
The missing years change the shape of the story rather than a detail inside it. The busiest year of the last eleven was 2021, not 2025. The page below is rewritten accordingly.
The record, year by year
| Year | Registered sales | Registered value | Average per sale | What the year was |
|---|---|---|---|---|
| 2016 | 64,248 | $8.40bn | ≈$130,800 | Before the collapse |
| 2017 | 73,541 | $15.01bn | ≈$204,000 | Before the collapse |
| 2018 | 60,714 | $8.13bn | ≈$134,000 | Before the collapse |
| 2019 | 50,352 | $6.84bn | $135,844 | The peg breaks in October |
| 2020 | 82,202 | — | — | Collapse-era surge begins |
| 2021 | 110,094 | — | — | The busiest year on this record |
| 2022 | 79,990 | — | — | The surge slowing |
| 2023 | 23,411 | — | — | Registries shut by strike most of the year |
| 2024 | 36,382 | $2.89bn | $79,488 | Reopening; reporting switches to LBP |
| 2025 | 70,981 | $6.16bn | $86,741 | Backlog of delayed deals cleared |
| 2026 | 34,549 | $3.74bn | $108,376 | January to August only |
2026 is a part year and is not comparable with the full years above it. Dollar figures are shown only where the conversion basis is consistent: 2016–2019 at the official peg of 1,507.5 pounds, and 2024–2026 at the 89,500 fixed since 1 February 2024. For 2020 to 2023 the published values were converted at the rates of the time and are left blank — see below. Averages are value divided by count, never the publisher’s own average figure, which reports the latest month rather than the period. The 2019 and 2024–2026 averages are computed from the precise published period values, so they differ slightly from the rounded billions shown in the column beside them; the 2016–2018 averages come from values published only to the nearest million and are marked approximate. 2017 carries an unusually high average and the source gives no breakdown of it.
The peak was 2021 — and it was not a boom
110,094 sales. More than double 2019, and 55% above 2025. It happened in the worst year of the worst economic collapse the country has had.
The four years to 2019, before the collapse reached the registry, averaged 62,214 registered sales a year. The three years after it averaged 90,762 — a 46% increase, during a period when the banking system had frozen withdrawals, the currency had lost most of its value and the state had defaulted on its debt. Normal demand does not behave like that.
Our reading, and we label it as ours rather than as source data: this was money leaving the banks. Depositors whose dollars were trapped behind informal capital controls could still move them inside the banking system by cheque, and property was one of the few things a Lebanese bank cheque would still buy. Sellers accepted those cheques at a discount; buyers accepted the discount to get anything at all out of their accounts. The result reads as a property boom in the transaction count and was closer to a bank run conducted in square metres. The General Directorate publishes the counts; it does not publish a reason for them, and neither does Bank Audi. The explanation above is Cedar Keys Estates’ interpretation of what we and our clients lived through, not a figure anyone has published.
By 2022 the flow was slowing — 79,990 sales, down 27% on 2021 — as the usable cheque money ran out.
Then the registries closed
2023 recorded 23,411 sales, 21% of the 2021 peak and the lowest figure on this record by a wide margin. Public-sector strikes kept the land registries shut for most of the year; the 2024 war later closed Saida and Nabatieh again. The 2023 number is not a measure of how many Lebanese wanted to buy or sell. It is a measure of how many were able to register it.
Two sales-basis figures exist for 2023: 23,411 from Bank Audi and 23,679 from Credit Libanais, 1.1% apart. We use Bank Audi’s throughout this table so that the whole eleven-year series comes from one publisher on one definition.
What 2024, 2025 and 2026 actually measure
36,382 sales in 2024, then 70,981 in 2025 — nearly double in a year. Credit Libanais, which republishes the Directorate’s monthly figures, says plainly that this is not demand:
“The bulk of the work of real estate registries nowadays, especially for those that remained most on strike, is geared towards the processing of backlogged real estate transactions. As such, the figures displayed do not reflect the real momentum of the real estate sector.”
A sale agreed in 2023 and registered in 2025 appears in the 2025 column. That cuts both ways: 2025 overstates the recovery, and every 2026 figure measured against it overstates the decline. Even at 70,981, 2025 sits well below 2021 and roughly level with 2017.
Why there are no dollar figures for 2020 to 2023
The Land Registry records values in Lebanese pounds. Converting them to dollars is straightforward either side of the collapse — 1,507.5 to the dollar up to 2019, and 89,500 fixed since February 2024 — but not during it, when the official and market rates diverged by a factor of sixty and both moved month to month.
The published dollar values for 2020 to 2023 were converted at the rates applied at the time. Divided by the sale counts they imply an average registered sale of $141,000 to $306,000 across those four years, against $135,844 in 2019. A market cannot have had higher average sale values during the collapse than before it; the conversion, not the market, produced that result. So we publish the counts for those years, which are measured directly, and leave the values blank rather than reproduce a number we cannot stand behind.
2026 so far
Through August, Lebanon registered $3.74 billion across 34,549 sales. Measured against the same point in 2025 the value gap has closed from 17.8% in May to 3.8% in August, while the transaction-count gap has narrowed more slowly, from 32.3% to 23.8%. Annualised naively that is roughly 52,000 sales — close to 2019, around half of 2021. We track this monthly and publish the read as it comes.
What these numbers are, and what they are not
- Sales, not registry activity. In the first seven months of 2026 the Land Registry handled 70,924 transactions in total but only 29,404 of them were sales. The rest are mortgages, liens, inheritance transfers and corrections. Every figure on this page counts sales only.
- Appraised, not paid. Registry values are appraised for fee assessment, not the price actually paid. Under-declaration to reduce fees is common in Lebanon, so treat these as a floor on real turnover rather than a measure of it.
- Registered, not all transacted. Sales concluded by notarised contract without registration do not appear at all. A material share of Lebanese property changes hands that way.
- Republished, not taken from the Registry directly. The Directorate’s own published reports carry nothing newer than June 2025. Everything after that date reaches the public through bank research desks, and we label it that way rather than calling it official Registry data.
- One thing on this page is interpretation. The deposit-flight explanation of the 2020–2022 surge is ours, and is marked as ours wherever it appears. Every figure on the page, in the table and in the chart, is published data.
Sources
Annual sale counts and values 2016–2025: Bank Audi, Lebanon Real Estate Sector, August 2026 edition, republishing General Directorate of Land Registry & Cadastre data. The 2026 series through August, and the precise 2019, 2024 and 2025 averages: Credit Libanais Economic Research Unit, republishing the same Directorate data, latest edition published 14 September 2026. Total registry activity against sales: Bank Audi, same edition. Pound figures converted at 89,500 LBP/USD for 2024 onward and 1,507.5 for 2016–2019. Figures last verified against source on 6 October 2026.
Mustapha Fouladkar, REALTOR®
Founder & Managing Director, Cedar Keys Estates S.A.R.L. — Member of REAL, the Real Estate Syndicate of Lebanon
Published 5 October 2026, rewritten 6 October 2026 when the 2016–2022 annual series came to light. This page is updated as new annual figures are published.
REALTOR® is a federally registered collective membership mark that identifies a real estate professional who is a member of the National Association of REALTORS® and subscribes to its strict Code of Ethics.
Where does your property sit?
We read this data every month
If you are weighing a sale or a purchase in Beirut or anywhere in Lebanon, we will show you where your area and your property type sit inside these numbers.