
Land Registry data · published 5 October 2026
Foreign ownership of Lebanese land, by district
How much of Lebanon is owned from outside it, district by district — read directly from the Land Registry’s own cumulative report, and published here in full.
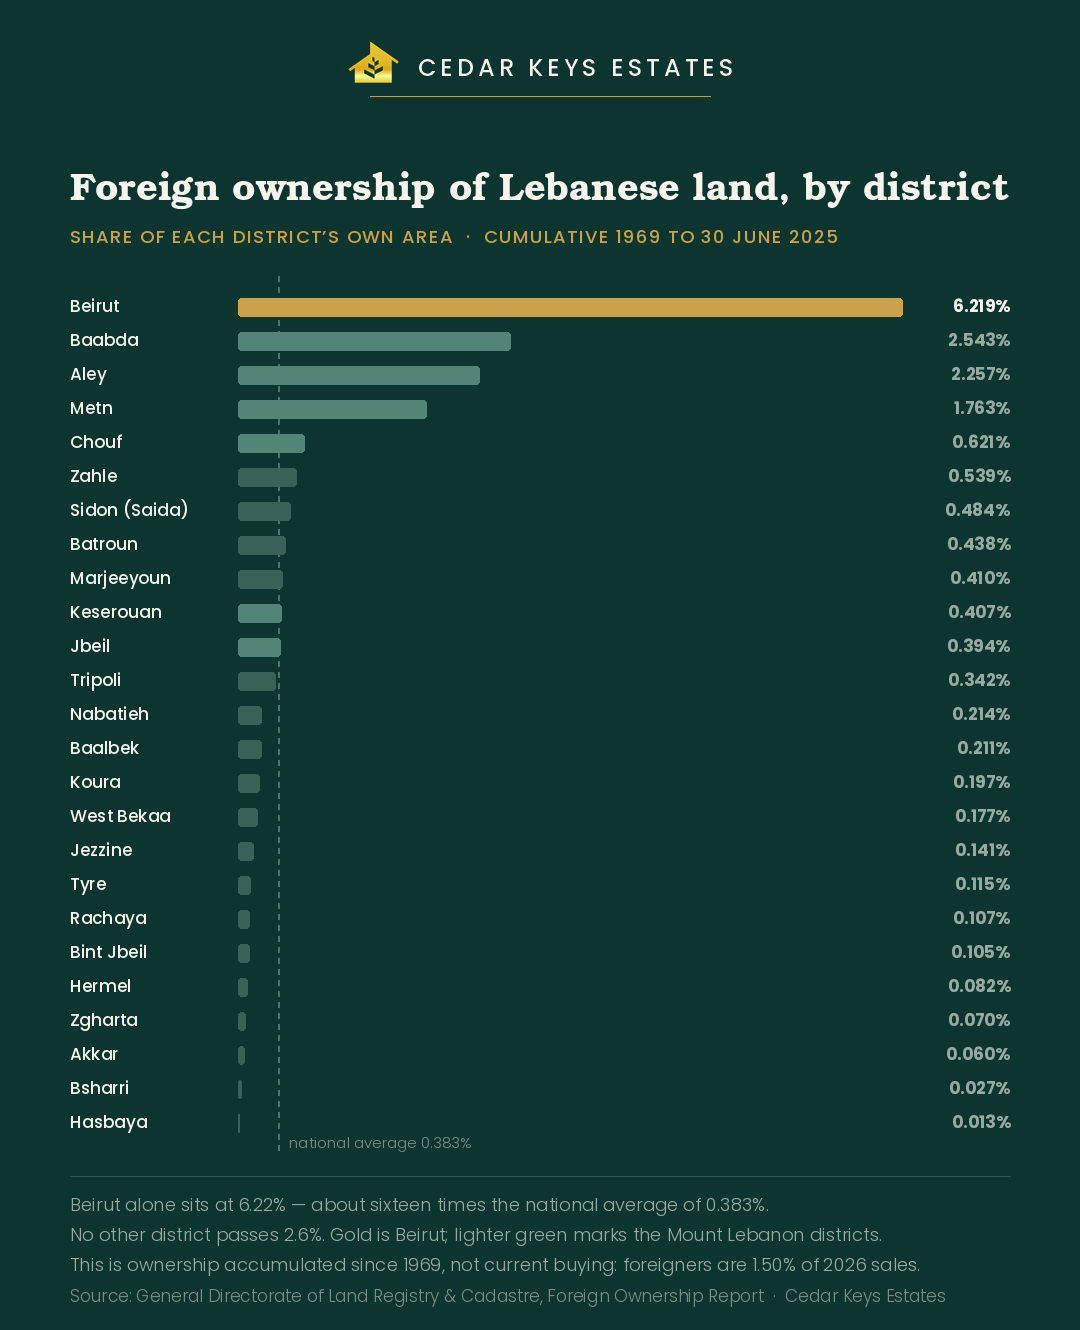
Across all 25 districts, 76,494 non-Lebanese individuals and 16,436 non-Lebanese companies hold 39,836,848 square metres of Lebanese land. Against a surveyed national area of 10,400,129,906 square metres, that is 0.383% of the country.
The full register, district by district
| District | Governorate | Foreign individuals | Their area (m²) | Foreign companies | Their area (m²) | Total (m²) | % of district area | % of all foreign-owned land |
|---|---|---|---|---|---|---|---|---|
| Beirut | Beirut | 11,934 | 351,520 | 6,518 | 755,474 | 1,106,994 | 6.219% | 2.78% |
| Baabda | Mount Lebanon | 10,517 | 3,828,334 | 1,244 | 1,002,655 | 4,830,989 | 2.543% | 12.13% |
| Aley | Mount Lebanon | 10,433 | 4,008,485 | 1,233 | 2,086,478 | 6,094,963 | 2.257% | 15.30% |
| Metn | Mount Lebanon | 8,676 | 2,192,011 | 1,873 | 2,568,991 | 4,761,002 | 1.763% | 11.95% |
| Chouf | Mount Lebanon | 4,767 | 1,601,489 | 325 | 1,317,572 | 2,919,061 | 0.621% | 7.33% |
| Zahle | Bekaa | 2,875 | 1,310,137 | 938 | 972,726 | 2,282,863 | 0.539% | 5.73% |
| Sidon (Saida) | South | 6,530 | 1,121,205 | 436 | 185,893 | 1,307,098 | 0.484% | 3.28% |
| Batroun | North | 1,679 | 527,339 | 1,093 | 667,757 | 1,195,096 | 0.438% | 3.00% |
| Marjeeyoun | Nabatieh | 126 | 44,732 | 65 | 1,308,950 | 1,353,682 | 0.410% | 3.40% |
| Keserouan | Mount Lebanon | 4,465 | 1,042,977 | 662 | 278,358 | 1,321,335 | 0.407% | 3.32% |
| Jbeil | Mount Lebanon | 923 | 486,841 | 418 | 1,068,643 | 1,555,484 | 0.394% | 3.90% |
| Tripoli | North | 4,354 | 531,339 | 257 | 938,114 | 1,469,453 | 0.342% | 3.69% |
| Nabatieh | Nabatieh | 1,439 | 571,822 | 41 | 5,997 | 577,819 | 0.214% | 1.45% |
| Baalbek | Bekaa | 1,632 | 4,038,354 | 196 | 1,040,619 | 5,078,973 | 0.211% | 12.75% |
| Koura | North | 647 | 242,918 | 94 | 96,490 | 339,408 | 0.197% | 0.85% |
| West Bekaa | Bekaa | 1,051 | 295,845 | 597 | 553,677 | 849,522 | 0.177% | 2.13% |
| Jezzine | South | 261 | 244,824 | 53 | 92,704 | 337,528 | 0.141% | 0.85% |
| Tyre | South | 1,045 | 458,488 | 150 | 60,870 | 519,358 | 0.115% | 1.30% |
| Rachaya | Bekaa | 1,201 | 547,247 | 25 | 20,836 | 568,083 | 0.107% | 1.43% |
| Bint Jbeil | Nabatieh | 62 | 340,349 | 0 | 0 | 340,349 | 0.105% | 0.85% |
| Hermel | Bekaa | 63 | 49,140 | 35 | 262,098 | 311,238 | 0.082% | 0.78% |
| Zgharta | North | 844 | 99,304 | 93 | 31,106 | 130,410 | 0.070% | 0.33% |
| Akkar | North | 693 | 468,695 | 46 | 37,693 | 506,388 | 0.060% | 1.27% |
| Bsharri | North | 239 | 26,938 | 44 | 15,488 | 42,426 | 0.027% | 0.11% |
| Hasbaya | Nabatieh | 38 | 37,326 | 0 | 0 | 37,326 | 0.013% | 0.09% |
| Lebanon — total | — | 76,494 | 24,467,659 | 16,436 | 15,369,189 | 39,836,848 | 0.383% | 100.00% |
Cumulative 4 January 1969 to 30 June 2025. Every column above sums exactly to the Directorate’s own stated national totals — owners and area, individuals and companies — which is how we know the table is complete. Percentages of district area are as published; the final column is calculated here as each district’s share of all foreign-owned land in the country.
Beirut is the outlier, by an order of magnitude
6.22% of Beirut’s land is in foreign hands, against a national average of 0.383% — about sixteen times the rate. No other district in the country passes 2.6%. Baabda follows at 2.54%, Aley at 2.26% and Metn at 1.76%.
Read as a map, foreign ownership in Lebanon is Beirut and its immediate mountain suburbs. It is not the coast, and it is not the resort towns: Jbeil sits at 0.394% and Keserouan at 0.407%, both below Zahle.
By raw area, the picture inverts
Beirut holds only 1,106,994 square metres of foreign-owned land — 2.78% of the national total. The largest holdings by area are in Aley at 6.09 million square metres (15.3% of all foreign-owned land in Lebanon) and Baalbek at 5.08 million (12.8%), followed by Baabda and Metn at around 12% each.
The two readings answer different questions. The percentage column tells you where foreign ownership is concentrated relative to the land available. The area column tells you where the hectares actually are. Beirut is dense and small; Baalbek is vast and mostly empty.
Companies do not behave like individuals
In Marjeeyoun, 65 foreign companies hold 1,308,950 square metres while 126 foreign individuals hold 44,732 — corporate landholding is twenty-nine times the individual footprint. Hermel shows the same pattern at five times, and Jbeil, Beirut and West Bekaa all run around two.
At the other end, Bint Jbeil and Hasbaya have no foreign corporate ownership at all — not one company on the register. Bsharri has the lowest foreign share in the country, 0.027%.
This is a stock, not a flow
The single most important thing to understand about this table: it is ownership accumulated since 1969, not a record of who is buying now.
Much of Beirut’s 6.22% is decades old. Current foreign buying is a separate and much smaller figure — foreigners accounted for 1.50% of Lebanese property sales in 2026 to August, down from a peak of 2.36% in 2024. The two numbers measure different things and should never be presented as one.
What this data is, and what it is not
- Area, not value. Every figure here is square metres of land. A square metre in Beirut and a square metre in Hermel are not comparable in money, and this report does not value them.
- Cumulative since 1969. It carries no date of acquisition, so it cannot show trend, recent activity or who bought when.
- The Directorate’s own caveat. The report states that figures may be incomplete where spatial or ownership-date information is missing from its database. That is their qualification, not ours, and we repeat it rather than smoothing over it.
- Land, not buildings. The register records land area. It does not count apartments, floors or built space, so a foreign-owned apartment in a Beirut tower contributes only its share of the plot.
- This one is Registry-direct. Unlike the monthly sales figures, which reach the public through bank research desks, this table is read straight from the Directorate’s own published report.
Sources
General Directorate of Land Registry & Cadastre, Foreign Ownership Report (rep1), cumulative 4 January 1969 to 30 June 2025 — owner counts and areas for non-Lebanese individuals and companies across 25 districts, with each district’s share of its own area. Re-checked against source on 25 September 2026 and unchanged; all six national totals reconcile exactly to the sum of the district rows. The 2026 foreigners’ share of sales is from Credit Libanais Economic Research Unit, republishing Registry data, article of 14 September 2026.
Mustapha Fouladkar, REALTOR®
Founder & Managing Director, Cedar Keys Estates S.A.R.L. — Member of REAL, the Real Estate Syndicate of Lebanon
Published 5 October 2026. The Directorate updates this report slowly; this page is revised whenever it moves.
REALTOR® is a federally registered collective membership mark that identifies a real estate professional who is a member of the National Association of REALTORS® and subscribes to its strict Code of Ethics.
Buying in Lebanon from abroad?
We handle the legal side
Foreign acquisition in Lebanon carries its own permissions, limits and timelines. If you are considering it, we will walk you through what applies to your situation before you commit to anything.